
Case Study — Home & Kitchen
Scaled Home & Kitchen Brand Amazon Revenue While Improving Advertising Efficiency
BakeDeco sells professional-grade bakeware, tools and kitchen supplies on Amazon. Vision Orix reorganized its ad campaigns and improved listings to help the brand grow more efficiently in the first half of 2026.
≈$5.6M
Total Revenue
Reported Amazon revenue, January–June 2026
278K+
Order Items
Order-item total reported in the case study; not independently verified
11.13%
ACOS
About $11.13 spent on advertising per $100 in ad-attributed sales
8.98×
ROAS
About $8.98 in advertising-driven sales for each $1 spent
01 / THE PROBLEM
The business was established. Its advertising had become inefficient.
BakeDeco sells professional-grade bakeware, baking tools and kitchen supplies on Amazon.com. The account had an established catalog and meaningful volume, but campaigns had accumulated over time without a unified structure.
Who: US-based Home & Kitchen seller with a deep catalog of bakeware and kitchen supply SKUs at an average of $20 per order item.
Stage: Established and profitable, but advertising had grown organically over years: lots of campaigns, no unified structure.
Goal: Scale total revenue without letting advertising costs eat into margin. Growth was only a win if efficiency held.
02 / WHAT WE FOUND
Our audit revealed five problems limiting profitable growth
Inefficient PPC structure
Legacy campaigns overlapped, making it difficult to distinguish research, proven performers and branded defense.
High wasted spend
Ads were appearing for searches that were not producing sales, wasting budget across the catalog.
Weak listing optimization
Key listings were underselling the products — hurting conversion on both ad traffic and organic traffic.
Volatile daily performance
Day-to-day ACOS swung widely, making budget decisions reactive instead of planned.
Poor keyword targeting
Profitable customer search terms were not being moved into tightly targeted campaigns, making it harder to invest in keywords that already worked.
03 / WHAT WE IMPLEMENTED
How we rebuilt the account, step by step
We improved campaign organization and product listings first. Then we focused on growing sales without letting ad costs rise unnecessarily.
Week 1 — Full account audit
We reviewed every campaign to identify successful searches, wasted spending and products whose listings needed improvement.
Week 2 — Campaign restructuring
We separated exploratory advertising from proven campaigns and directed more budget toward search terms that generated sales.
Week 3 — Listing optimization
We improved titles and product descriptions using the language shoppers searched for, helping more visitors become customers.
Week 4 — Scaling campaigns
We increased budgets for efficient campaigns, expanded brand advertising and focused on search placements with stronger conversion.
Week 5+ — Continuous optimization
Each week, we moved successful searches into focused campaigns, excluded irrelevant searches and adjusted bids to maintain efficiency.
04 / BEFORE & AFTER
What changed in the way the account worked
The outcome was not one isolated PPC adjustment. It was a stronger operating structure connecting paid traffic, search relevance, listing quality and weekly decisions.
BEFORE
- Manual, reactive bid management
- Broad targeting with unchecked wasted spend
- Poor campaign segmentation and overlapping targets
- Weak keyword harvesting — winners left in auto campaigns
- Listings underselling the products
AFTER
- Structured PPC architecture with clear campaign roles
- Systematic negative keyword implementation
- Sponsored Brand campaigns built and optimized
- Budget allocation weighted to proven performers
- Weekly search term harvesting into exact match
- Placement strategy tuned to top-of-search conversion
05 / THE RESULTS
The results: stronger sales and advertising efficiency
For January–June 2026, the existing case study reports the following figures. Total Amazon revenue and advertising-attributed sales are different measurements.
TOTAL AMAZON REVENUE
≈$5.6M
Reported approximate total revenue; confirmation against Amazon sales reports is pending.
AD-ATTRIBUTED SALES
$1.65M
Sales attributed to advertising, not total Amazon revenue.
BLENDED ACOS
11.13%
About $11.13 in advertising for each $100 in ad-attributed sales.
ADVERTISING ROAS
8.98×
About $8.98 in ad-attributed sales for every $1 spent.
The advertising figures can be read from the Amazon Ads report. Total Amazon revenue and order counts are separately reported figures that need confirmation against an Amazon sales report.
06 / PERFORMANCE EVIDENCE
Amazon Ads results from the account
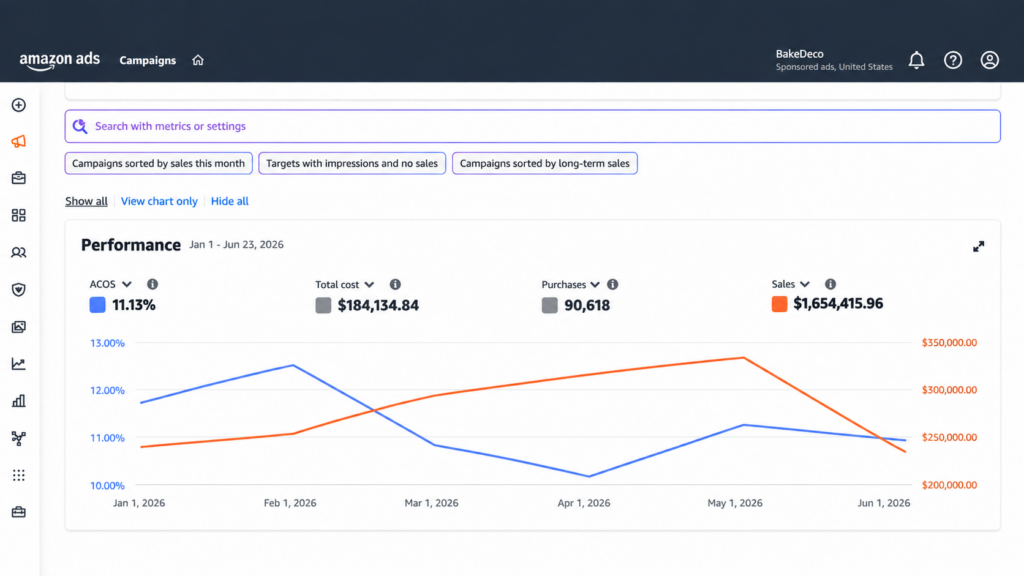
This Amazon Ads screenshot shows advertising performance from January 1 to June 23, 2026.
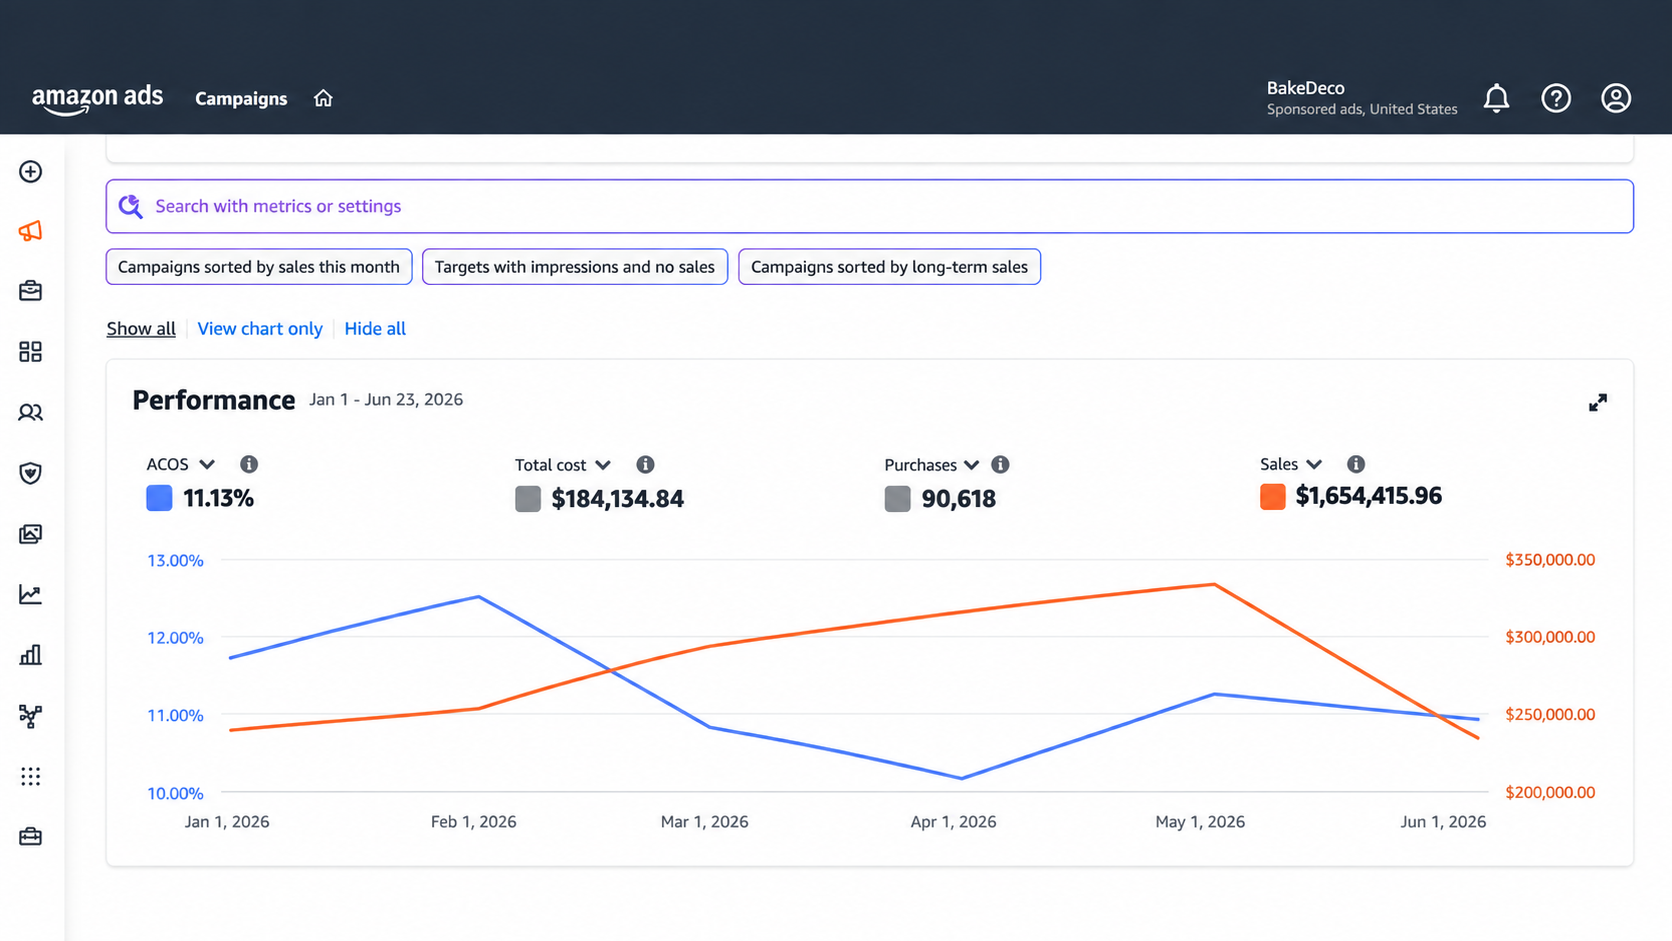
What it shows: The half-year view of all sponsored campaigns. $184K in ad spend generated $1.65M in ad-attributed sales and 90,618 purchases — a blended ACOS of 11.13%, or roughly $8.98 back for every advertising dollar.
Why it matters: From March onward, ad sales (orange) climb steadily while ACOS (blue) drops toward 10% — sales rising while efficiency improves. The screenshot documents advertising results, not a separate before-and-after comparison of total Amazon revenue.
07 / WHY IT MATTERS
What this means for BakeDeco
For the first half of 2026, the case study reports approximately $5.6 million in total Amazon revenue. The Amazon Ads screenshot documents about $1.65 million in advertising-attributed sales and 11.13% ACOS—approximately $11.13 spent on ads for every $100 of ad-attributed sales. The total Amazon revenue is a separate, not independently verified account figure.
The key takeaway: advertising-attributed sales increased while the percentage spent on advertising decreased later in the period. BakeDeco now uses clearer campaign structures, stronger listings, and weekly improvements rather than reactive bid changes.